Modeling the Economics of Residential Solar
I’ve enjoyed trying new technologies for as long as I can remember. As a new homeowner, a new world of technology is now relevant to my life.
Over the last few months, I’ve gotten excited about ways to improve my home’s energy efficiency and carbon emissions 1. My exploration sparked my interest in fully electrifying my home through electric heat pumps, water heaters, lawnmowers, EVs, etc.
Transitioning to these new technologies meant my electricity consumption was about to shoot up, so I started investigating generating my own power using solar panels 2.
Unfortunately, adding residential solar panels is a costly upfront investment. Each solar vendor I spoke to assured me solar makes financial sense, but I remained skeptical. They make their living selling solar panels, after all.
Do the savings justify the cost?
Heading into this research, I was predisposed to view solar panels on my roof primarily as an investment — I spend some money upfront and receive a monthly income stream over the system’s lifetime in the form of avoided utility bills.
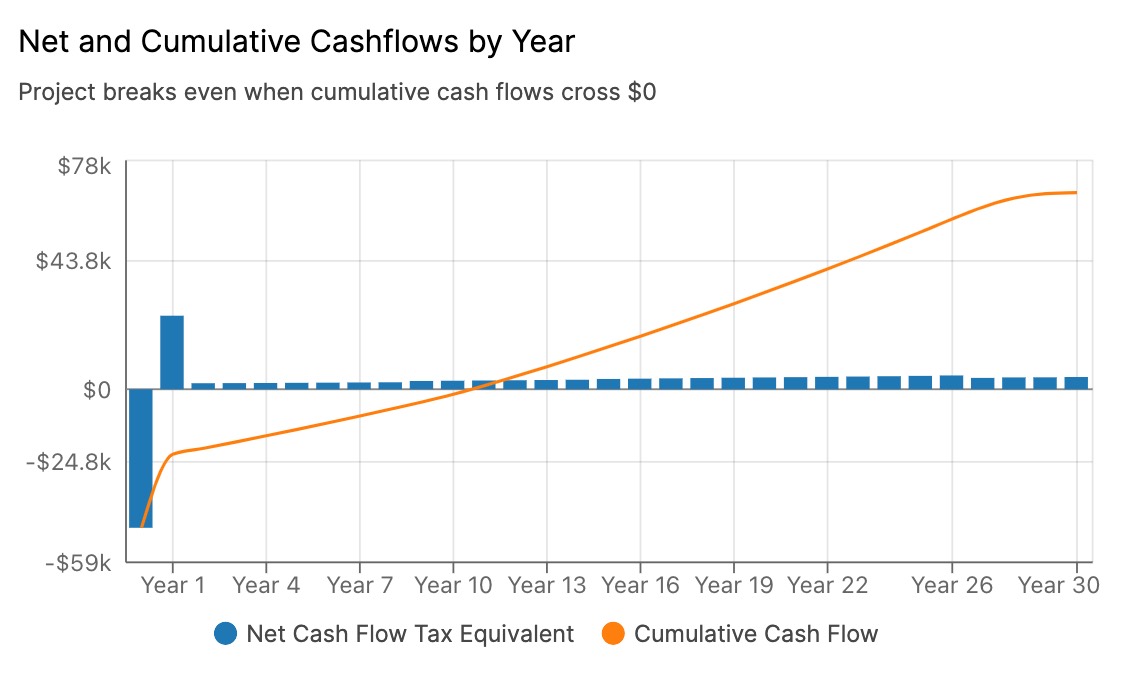
The most intuitive way for me to assess residential solar as an investment is the Payback Period, or how long it takes for the electricity cost savings to offset the initial investment. The rough math points to it taking about ten years to break even. Because solar systems typically last approximately 25 years, I would have another 15 years of “free” electricity.
However, does waiting ten years before I make a profit make sense?
Skip to the fun part
In this post, I’ll explain how I approached modeling the finances of a residential solar installation and what I learned about the overall economics of residential solar.
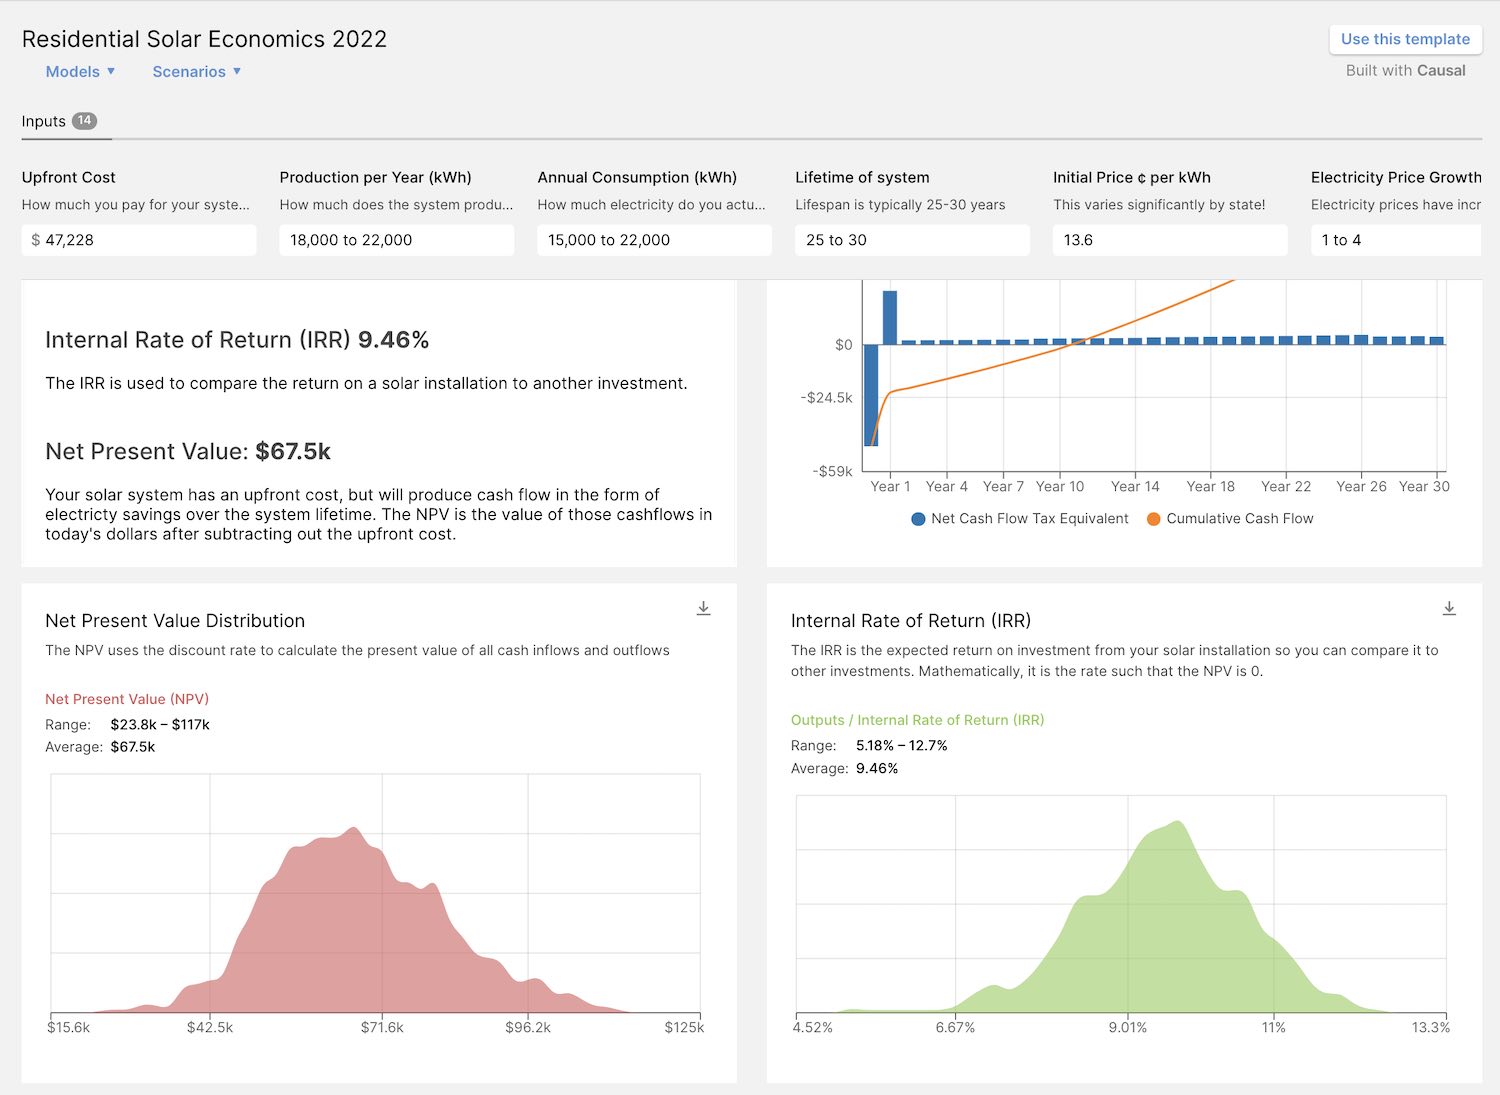
I also wanted to create something others could use, so I built SolarCellsWork.com (note: best viewed on desktop). I recommend playing around with the site to go along with my explanations here.
System Overview
I plan to install a grid-tied system, the most popular type of renewable energy setup in American homes. This means my solar panels must be connected to the broader electric grid to operate.
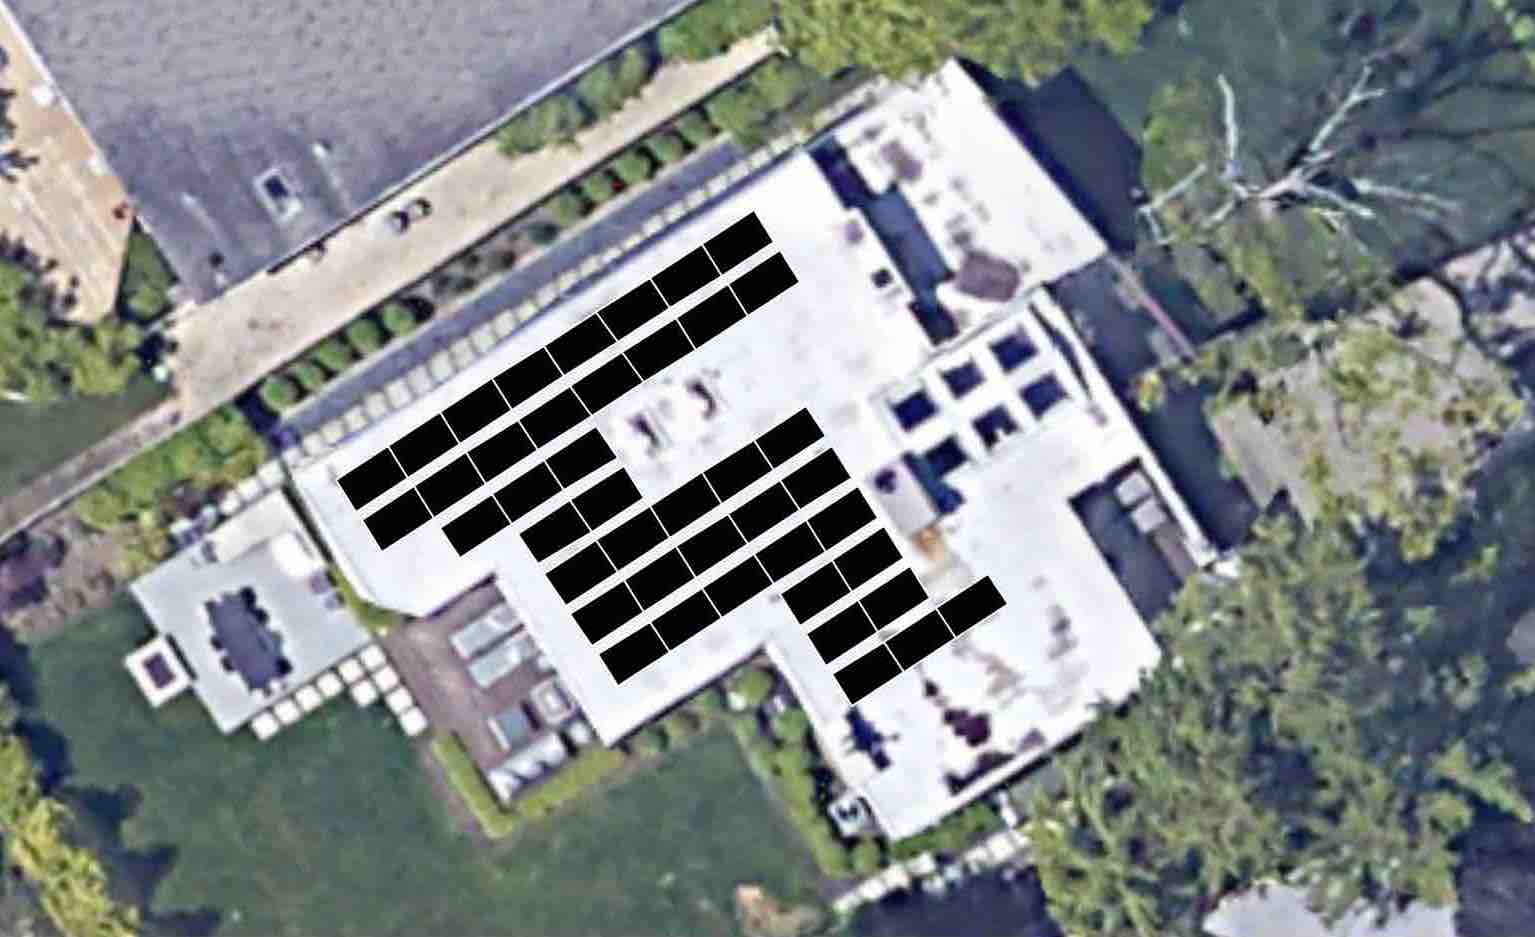
The advantage of being connected to the grid is that I can send the solar system’s excess energy production back to the grid. In exchange, I receive a credit that can offset any electricity I pull from the grid when my solar panels aren’t producing enough electricity.
This arrangement is known as “net metering,”. The way I like to think of it is that my meter runs backward when I produce more electricity than I am using.
Net-metering has two significant advantages.
First, I do not have to install an expensive battery to store energy to power my house when the sun isn’t shining. Instead, I can use the credits earned when my system overproduces to pay down my energy bill when the system underproduces. For example, I expect my system to generate extra credits during the summer that I will use during the winter when the sun shines up to 6 hours less per day (in the Chicagoland). The primary downside is that my system cannot supply power to my house without a battery when the grid is down. However, nothing I am doing prevents me from adding this to my system in the future.
Second, net metering makes it much simpler to model the economics of the system. My credits offset usage 1 to 1 and roll over month to month, resetting just once a year. That means I only have to look at the difference between my annual production and consumption when looking at energy costs. The net metering rules vary from state to state, which you can read more about here.
This post was already getting too long, so I won’t go into the details of how I chose which model of panels to use (), but if you know the total installation and material costs and estimated annual electricity production, you can use this calculator to help decide between options.
Incorporating Uncertainty
Solar is a multi-decade investment, so forecasting is inherently unpredictable. As I did this analysis, I had to make several assumptions.
To make the model as useful as possible, I allow users to supply a range of values for each input and see the resulting distribution of possible outputs based on a Monte Carlo simulation. I was excited to add this feature since other calculators I found online present only one possible outcome rather than the range of possibilities. Big shout out to a product named Casual that made it easy to build this tool. The probabilistic nature of the simulation is why you might see slightly varying numbers in the screenshots in this post.
If you are using the model yourself, you can input whatever values you’d like for each input. To make it easier to use, I wanted to set some sensible defaults, which I’ll explain in the context of the system I plan to build.
Determining the cash flows
Calculating the expected return is not as simple as adding up all the projected avoided utility bill expenses over the system’s lifetime. That is because a dollar in the future is worth less than a dollar today i.e. the time value of money.
To accurately understand the system’s value, we need to consider the amount and timing of its cash inflows and outflows over its lifetime. Based on the timing, we can calculate what that future dollar is worth today by calculating the Present Value. Using present value, we can apply typical financial modeling techniques like discounted cash flow to value the investment.
Cash Outflows
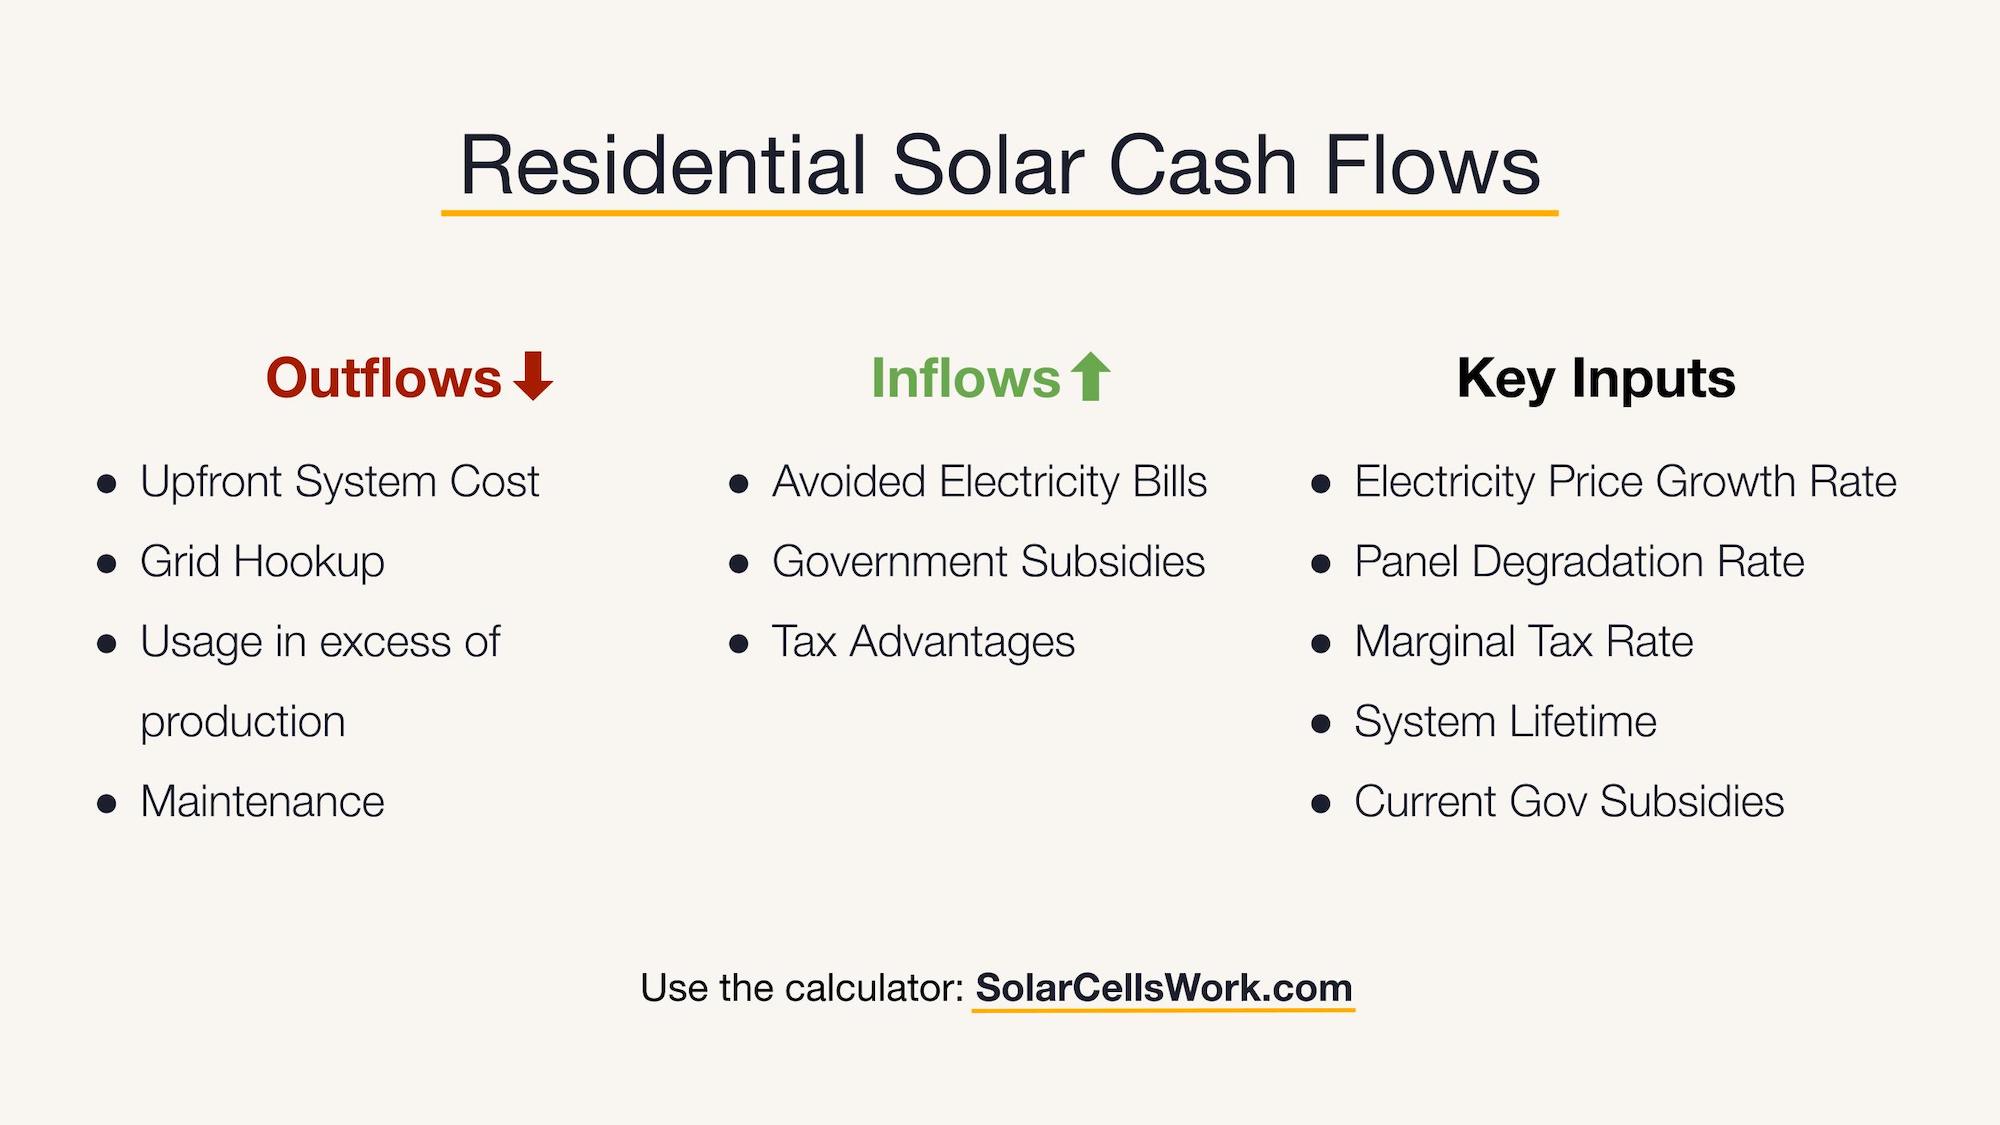
To start, we need to pay the upfront costs of the system 3. In my case, it was $47,000 for a 19,000 kWh system. Additionally, federal tax credits and state programs offset this initial amount. As of writing this, that is 26% federal tax credit and SRECs 4 worth ~$64 per MWh of estimated production over 15 years in Illinois, where I am installing my system.
As an aside, most vendors’ proposals subtracted the entire Illinois incentive off the purchase price, omitting that any amount you receive may be taxable. Although I don’t expect my solar vendor to provide tax advice, this omission works in their favor when presenting the effective system cost. Therefore, I recommend that the user inputs the after-tax state incentive value to the model.
Regarding the timing, the model assumes we receive the federal and state incentive value after one year, although they may come sooner in reality.

There are two other minor cash outflows.
First is the cost of maintaining your grid hookup, which is a required monthly payment and is necessary unless you built an entirely off-grid system with a battery. By retaining the hookup, you can use the grid when your consumption exceeds your production. When annual consumption exceeds production, the calculator will calculate the marginal cash outflows based on the electricity rate at that time.
The second outflow is the annual maintenance cost for the panels. Overall, a solar installation typically requires very little maintenance outside of things covered by the warranty. Nonetheless, depending on where you live and how much rain you get, the panels may get dirty with dust, bird droppings, leaves, etc. A fair estimate seems to be $200/year, although that is likely high.
The cost of maintaining the grid hookup and the panels are adjusted by inflation (defaults to 2%) each year in the model.
Cash Inflows
In terms of cash inflows, the income from utility savings occurs monthly after installing the panels, but the amount depends on the price of electricity and the amount produced, which are not static values. That means we need to forecast those values over the system lifetime.
According to the latest data, electricity prices have gone up 8.8% in the past year in the United States! From a historical perspective, that is an anomaly — the average over the last 100 years has been 1-2%. The amount of income is sensitive to this input. The greater your belief electricity prices will continue increasing, the more attractive your solar investment will be. By default, the model simulates a 1-4% electricity price growth rate.
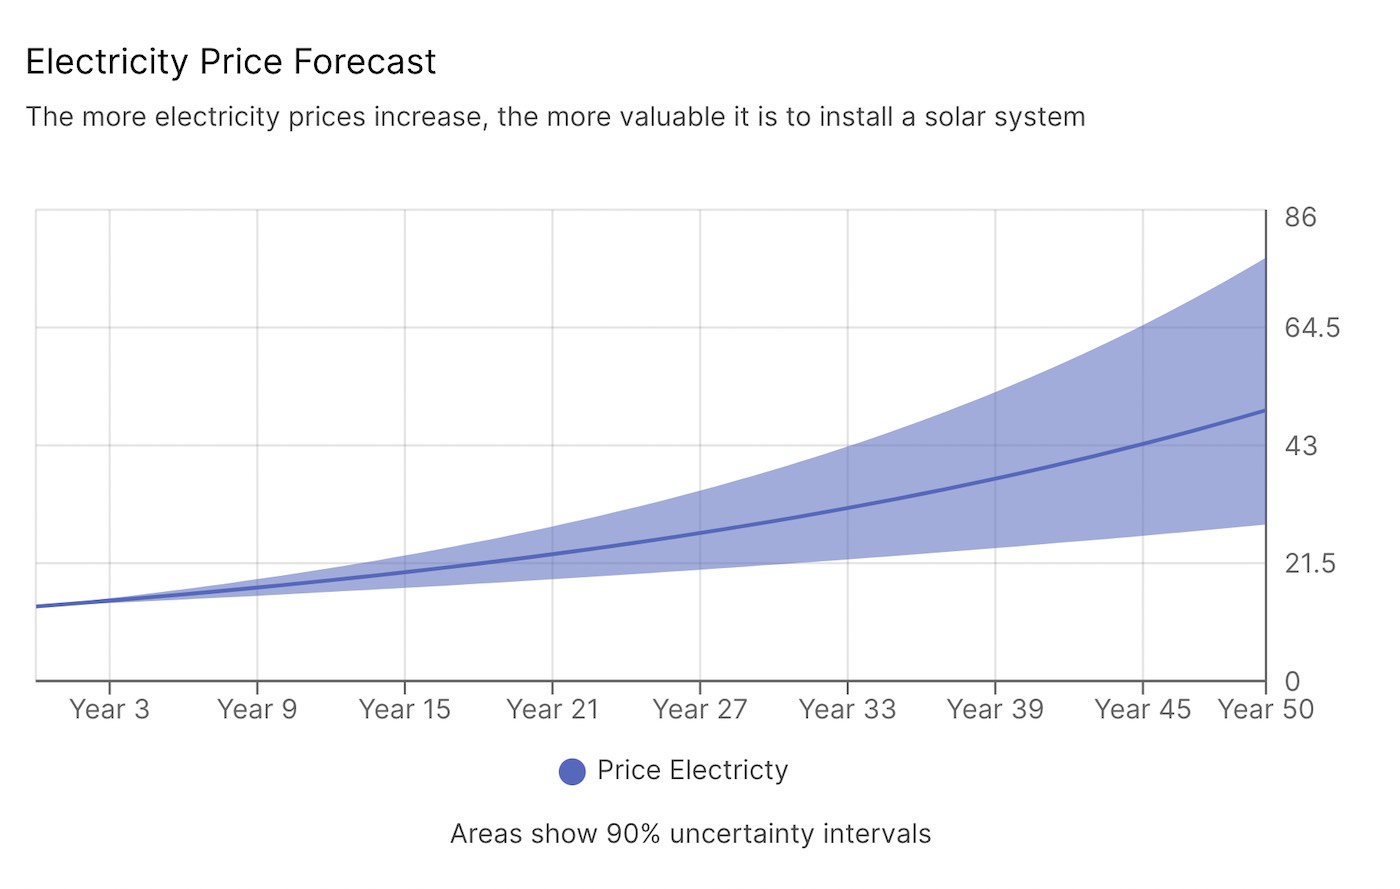
In terms of production, solar panels typically have warranties that last 20-30 years, and for the energy production to degrade less than .5% a year during that time. That means that after 30 years, production could just be 86% of the initial amount. To be conservative, the model described here assumes the output from the panels drops to 0 after the system warranty has elapsed. In the real world, they very well might continue producing electricity after this time.
One interesting observation is that money not spent on utility bills isn’t taxed. If I save $100, 100% of it goes into my bank account. However, $100 in income from wages or investment returns is taxed. So, if my marginal tax rate is 40%, the $100 utility bill savings is equivalent to $167 in income from another source. If you provide your margin tax rate, the model will adjust any cash inflows after the payback period elapses. Those inflows are the “profits” from the investment that don’t get taxed since they aren’t technically income.
Below, we can see what the projected net cash flow (inflows minus outflows) looks like per year for my system.

Analyzing the Return on Investment
With the amount and timing of the cash flows, we can calculate the present value.
To calculate the present value, we need to choose a “discount rate,” which is the rate of return we would expect if we invested the money elsewhere 5. We can then use this discount rate to calculate what our future income will be worth today. The higher the discount rate, the less the future income is worth today.
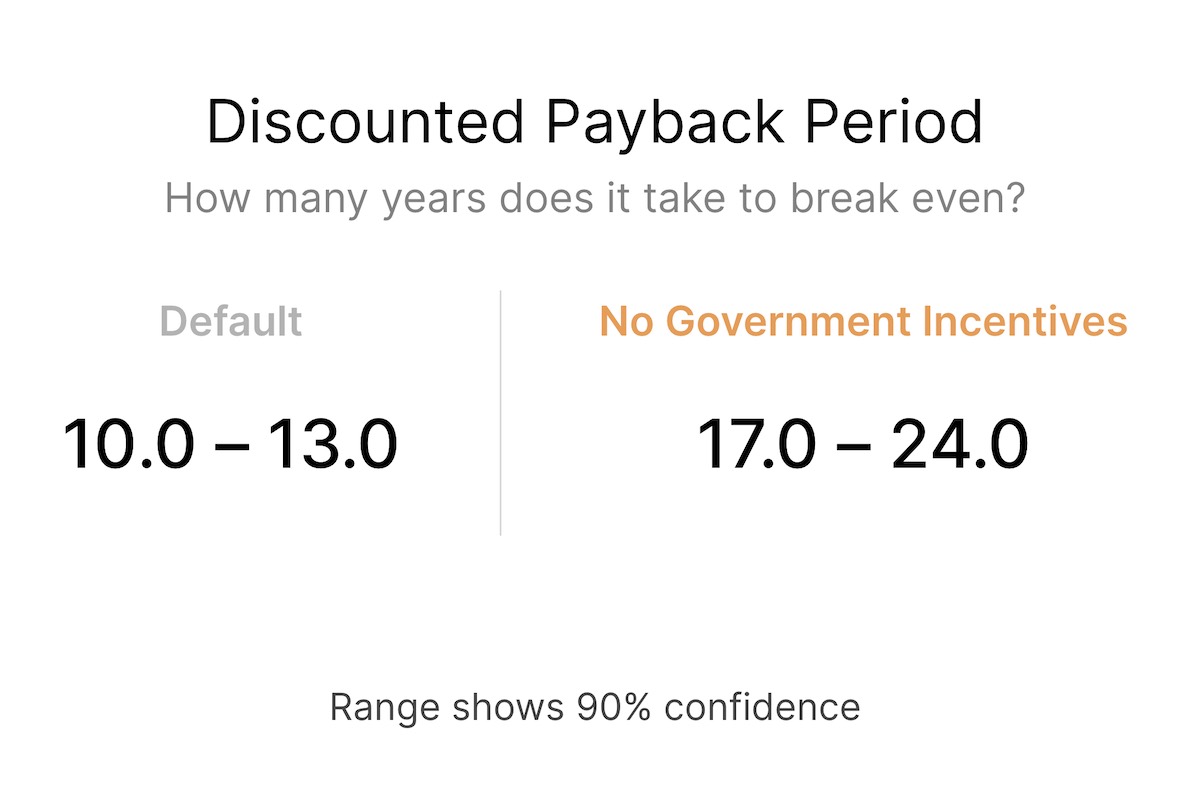
The first statistic I included in the financial model is the Discounted Payback Period, or the number of years to recoup the initial investment after considering the time value of money. This statistic gives a sense of how long until the system is profitable, which is the goal of any investment.
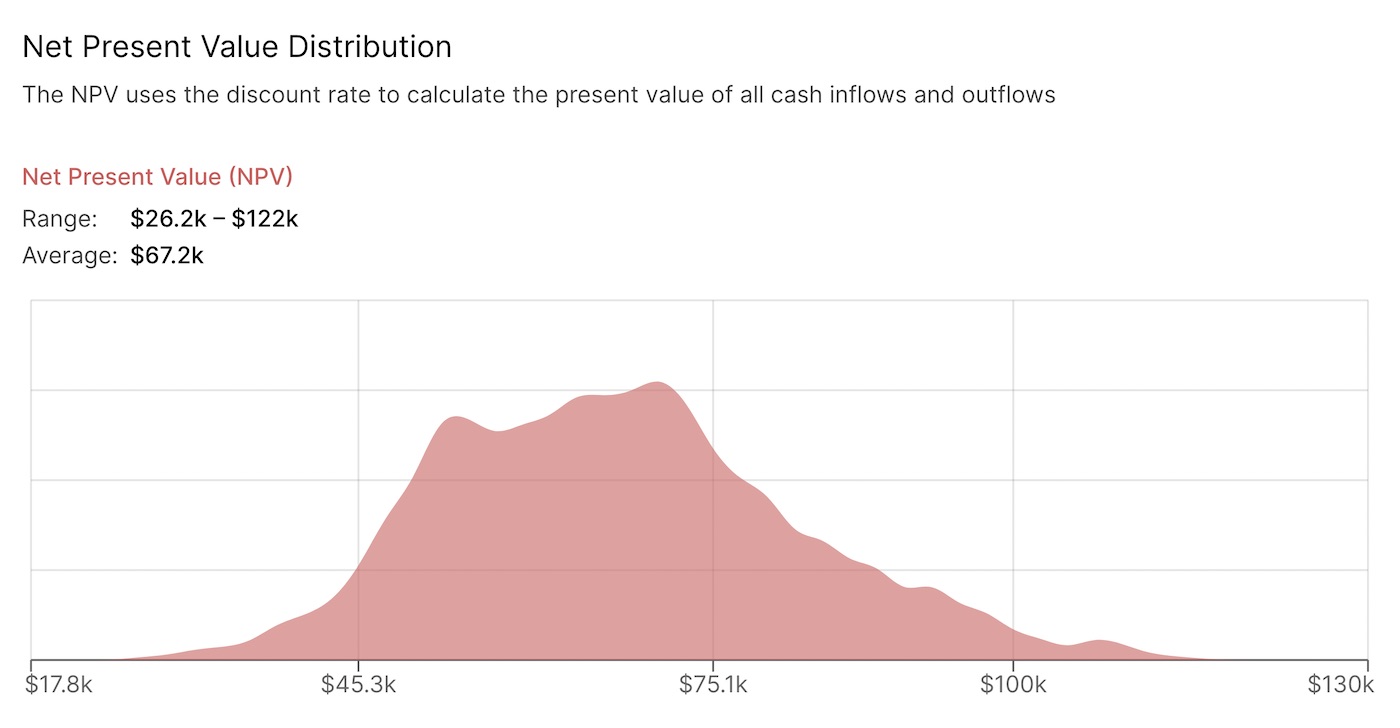
However, a solar system will typically continue producing energy for many years after the payback period. To understand the total profit in today’s dollars, we can add the present value of each month’s income and subtract the upfront cost. This value is called the Net Present Value. If the NPV is positive, that means the solar system is profitable after taking into account the time value of money.
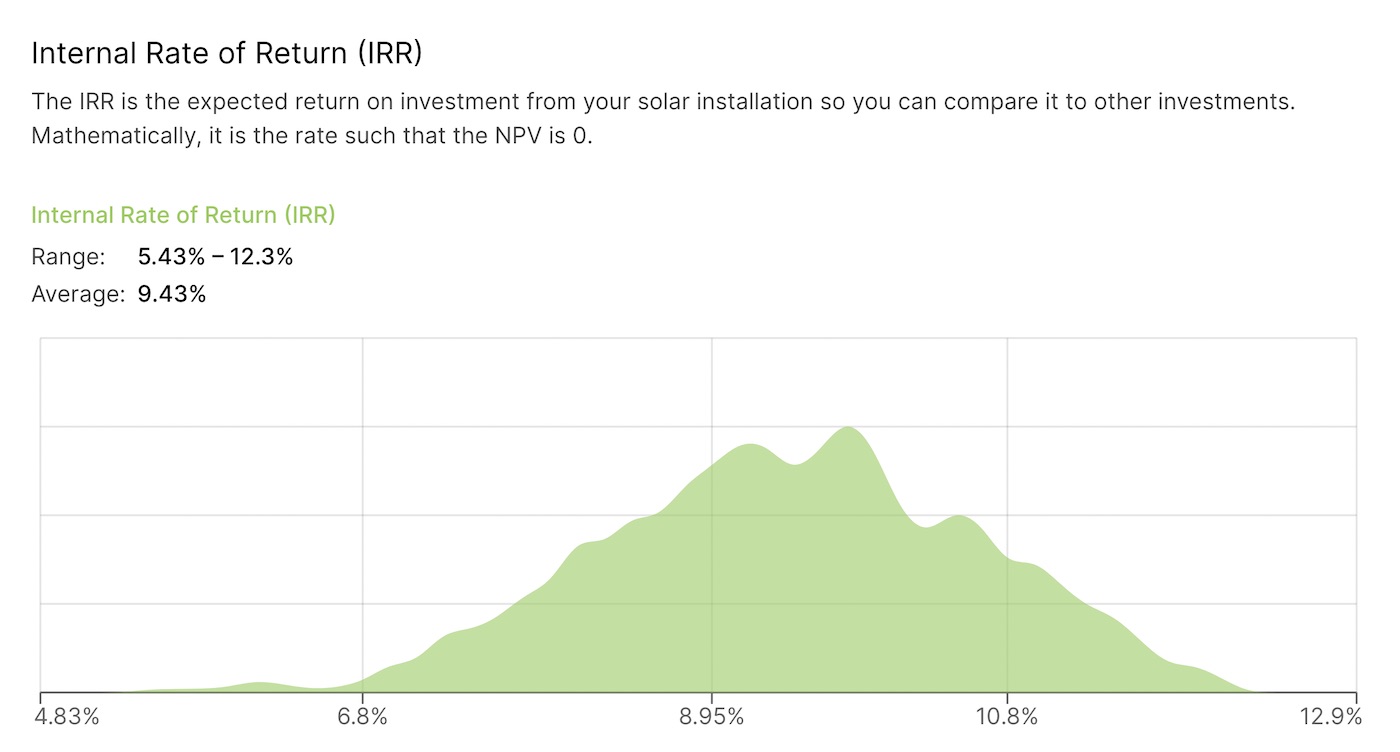
The NPV is an absolute dollar amount, making it hard to compare to other investments. Instead, we can look at the Internal Rate of Return or the discount rate such that the NPV is zero. The IRR describes profitability as a percentage, making it easier to compare to other investments 6.
For example, since its inception, the S&P 500 has averaged a ~10% annual return, so an IRR above 10% would make solar an attractive investment relative to buying the SPY ETF, all other things equal.
Takeaways
Solar makes financial sense
Based on my analysis, the NPV of my solar system is ~$67,000. That means that my installation is solidly profitable after considering the upfront costs, my utility bill savings, the time value of money, and every other cash flow I described above. Even more, my forecasted IRR is ~9.43% which is competitive with other investments I could make.
Furthermore, I expect the income from solar panels to be a relatively safe investment. I don’t expect my solar panels to stop producing, and I know I will need electricity in the future. This was out of the scope of my analysis, but I also wonder if the income from my solar investment adds diversification relative to my other investments, primarily in public stocks, bonds, and early-stage startups.
Conversely, a solar system is not a very liquid asset. The only feasible way to sell it would be to sell my house. It’s not exactly clear if solar panels increase the value of a home, but the evidence (admittedly from sources with a vested interest in the answer) points to yes.
Solar benefits those with higher tax rates

As I described earlier, the utility bill savings are tax-advantaged after the payback period has elapsed. That is because you don’t need to pay taxes on income from the money you don’t spend. That means if you pay a 40% marginal tax rate, you will have a more significant economic benefit than someone who pays a 0% marginal tax rate.
Net metering is a great deal
With net metering, you receive a credit worth what it costs you to buy electricity, which is called the “retail rate”. However, if you were to have sold your excess production on the wholesale energy market (i.e., what the utility pays to purchase electricity from power plants), you would have been paid the wholesale rate, which is likely much lower.
As a result, you might be getting paid more for your electricity with net metering than what the free market would pay. One way to demonstrate this — even though the costs of solar have gone down, the amount solar owners get paid for their generation has remained pegged to the retail rate of electricity which hasn’t similarly decreased.
Furthermore, the electric grid has a high fixed cost to operate that you avoid paying with net metering. The typical residential customer pays only a small fixed fee on their bill and has all other utility costs built into their per kWh charge.
At the extreme, net metering can result in paying for no power from the grid. In that case, the customer is not contributing to the fixed costs required to maintain the grid. hese costs need to be paid, resulting in higher rates from non-net metered customers.
There are proposed alternatives such as “value of solar”, where utilities pay a market price based on the value of the solar energy to the grid and commit to that price for 25 years, but net metering seems to be favored for it’s simplicity and economic benefits for now.
Government subsidies might not be required to sustain solar investment
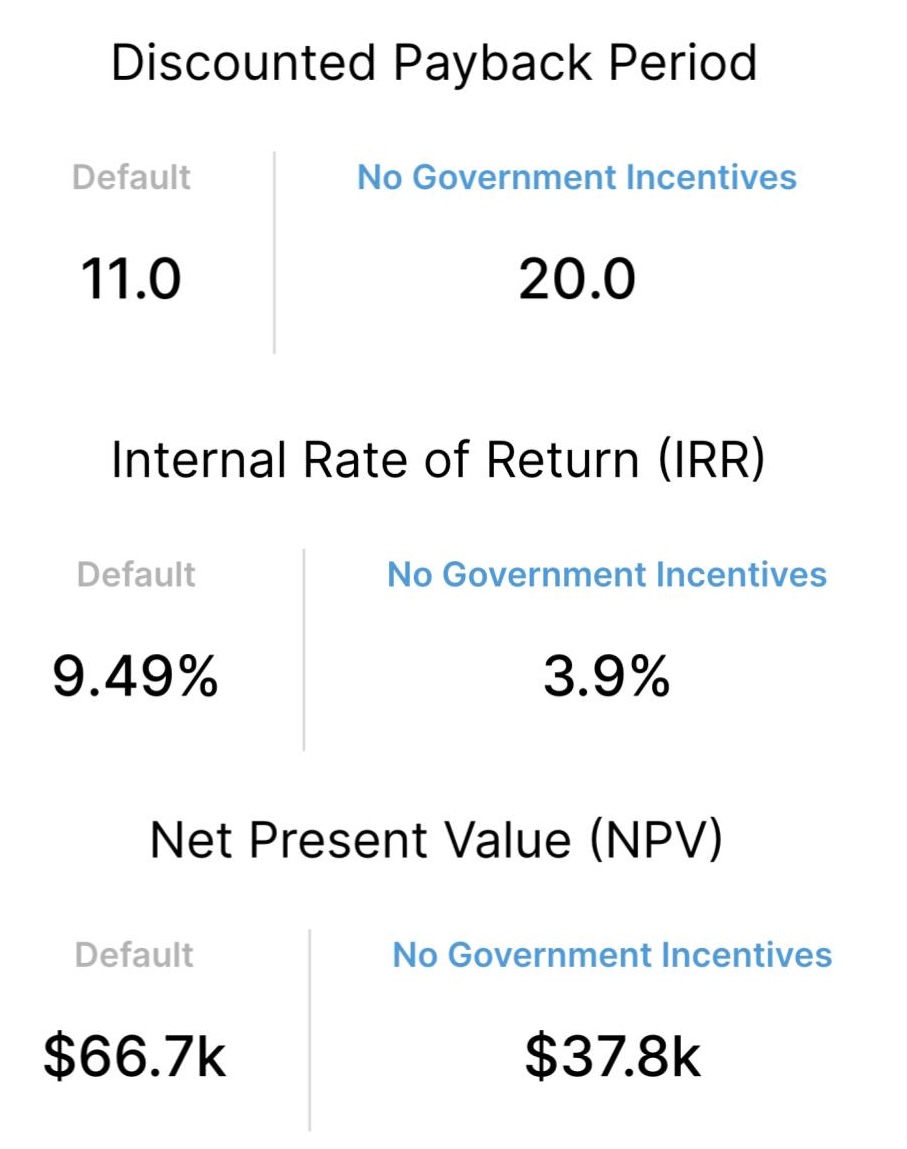
Without government subsidies, the NPV of the system is still positive, with a ~4% IRR. That means it is still a profitable investment even without government subsidies. If costs to install solar panels continue to drop, this return would only go up.
While I expect solar would still get built, government subsidies likely accelerate their adoption by convincing people at the margin to install. In my case, government subsidies cut the payback period in half, and anecdotally that seems to be the metric skeptics I’ve spoken to care about the most.
The federal subsidy will decrease from 26% to 22% in 2023 and then drop to 0% in 2024 for residential installations (it only drops to 10% commercial and utility-scale). I am interested to see if Congress will renew the federal solar investment tax credit for residential installations and what happens to adoption if they don’t.
Where to go from here?
A significant motivation for this project was to test my understanding of the economics of residential solar by explaining it others. I hope a side effect of that would be also to help people considering going down the same path as me.
However, as I spoke to people, I realized that most homeowners don’t approach the decision to install solar panels from a place of 100% financial rationality. Even if they have the cash on hand, the 10-year or more payback period disinterests them, and software demonstrating it is good investment over the long run doesn’t effectively counter that feeling. In the end, if they spend tens of thousands of dollars on their home, they have other things they are more interested in — unless they are an energy or technology nerd.
The more impactful tactic would be to convince people that solar will improve their lives rather than save them money. One possible route would be to emphasize that a solar system with a battery can provide backup against grid failure. This approach could be effective because, on average, U.S. electricity customers experienced just over eight hours of electric power interruptions in 2020.
Regardless of if someone installs solar panels, I fully expect electrification to take over the home and people’s lives. I’m excited to see all the new technology that gets built!
If you have any feedback on what I’ve built or discussed here, please send it my way!
Thanks to Gaurav Sheni for reading drafts of this post.
As this article explores, energy improvements to a dwelling often take decades or more to pay off. As a renter of many different apartments with one to two year leases, I had little incentive to make such an investment. This is a big problem because landlords also have no incentive to make these beneficial investments. That is because any energy bills savings are realized by the renter paying the utility bill. As a result, energy efficiency investments that have economic value rarely happen in leased dwellings. One possible way around this is to create regulation that requires landlords to disclose energy costs alongside advertised rents. Such disclosure would expose landlords with energy inefficient dwellings allowing landlords to charge higher rents for energy-efficient units. ↩︎
I’m not alone in seeing the potential for solar power. As our society increasingly aims towards a future powered by 100% clean energy, solar power will likely play a significant role. Solar is the fastest-growing source of new electricity generation in the United States – growing 4,000 percent over the past decade. This trend appears to have room to run. According to one report, “The United States has the potential to produce more than 100 times as much electricity from solar PV and concentrating solar power (CSP) installations as the nation consumes each year.” ↩︎
Some people may choose to finance their solar installation, but the calculator doesn’t handle this case yet. Based on my research, the loan payments end up being very similar to your utility bill. So, while you will reduce your carbon emissions, you likely won’t come out significantly ahead monetarily if you finance your system. Please let me know if it’d be helpful to add loan payments to this model! ↩︎
The federal tax credit is straightforward, but the state program in Illinois is funded by providing Solar Renewable Energy Credits, or SRECs, based on estimated electricity generation. An SREC is an asset representing the renewable attributes of one megawatt-hour of electricity generated by your solar. So if a utility wants to say they produced clean energy when they didn’t, they can buy one of these credits (which they are required to by law at a price set by the state of Illinois). Interestingly, once you sell your SREC, you can no longer say you are producing clean energy. Instead, you are producing clean energy on behalf of the entity that bought it. ↩︎
Choosing a discount rate is more art than science. A common approach is to utilize the “risk-free rate,” which is the rate of return offered by an investment with zero risk, such as a government bond. Here is a video on how Warren Buffet thinks about picking a discount rate. ↩︎
I am describing the standard IRR formula that assumes cash flows are reinvested at the same IRR they are earned. This makes sense for an investment where you can reinvest the cash flow in the initial investment—for example, buying more stock with dividends. However, you cannot do that with a solar system. A better approach would be to use a Modified IRR calculation that assumes cash flows are reinvested at a risk-free or user-specified discount rate. This would have the impact of lowering the estimated IRR. ↩︎